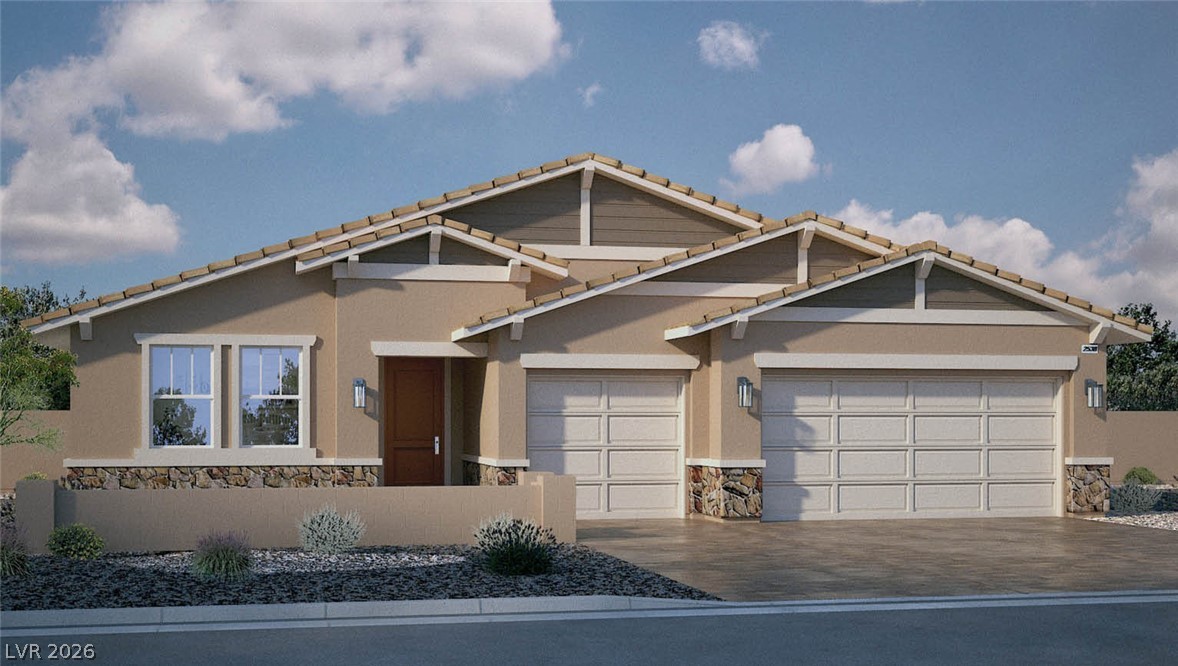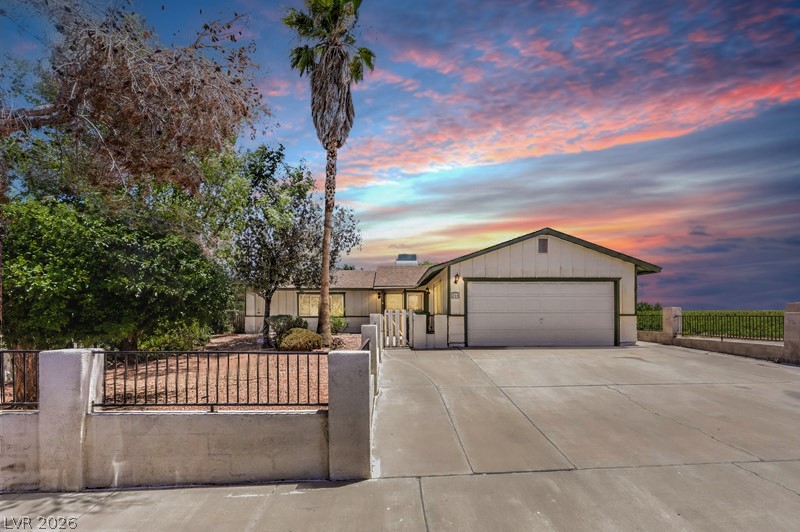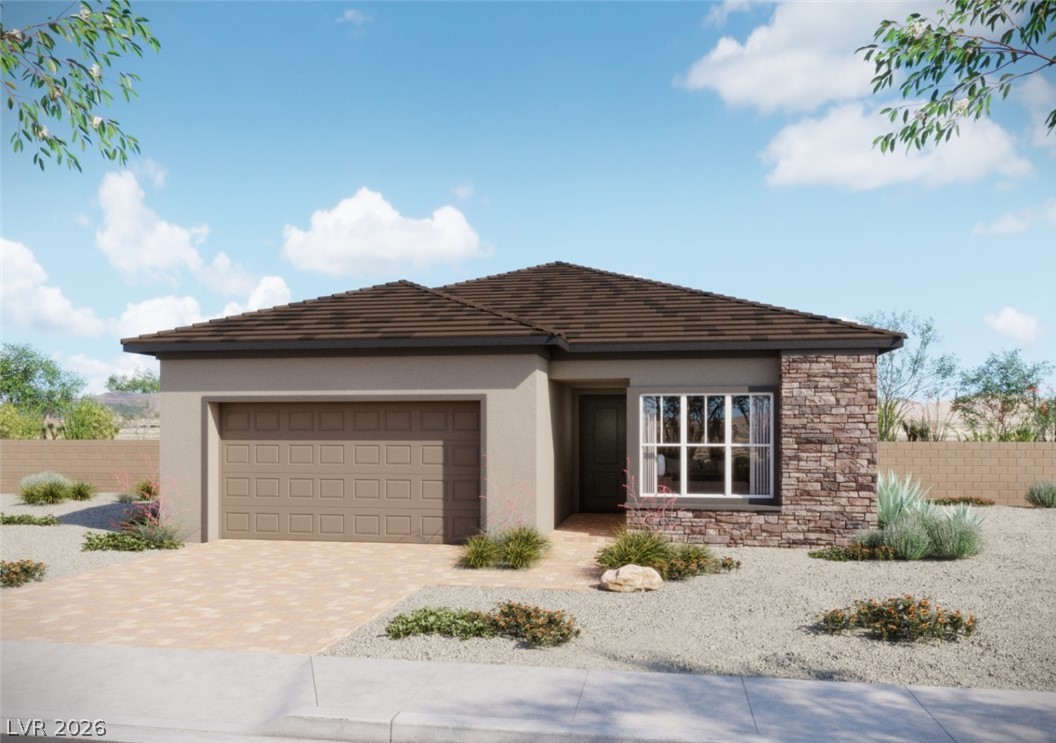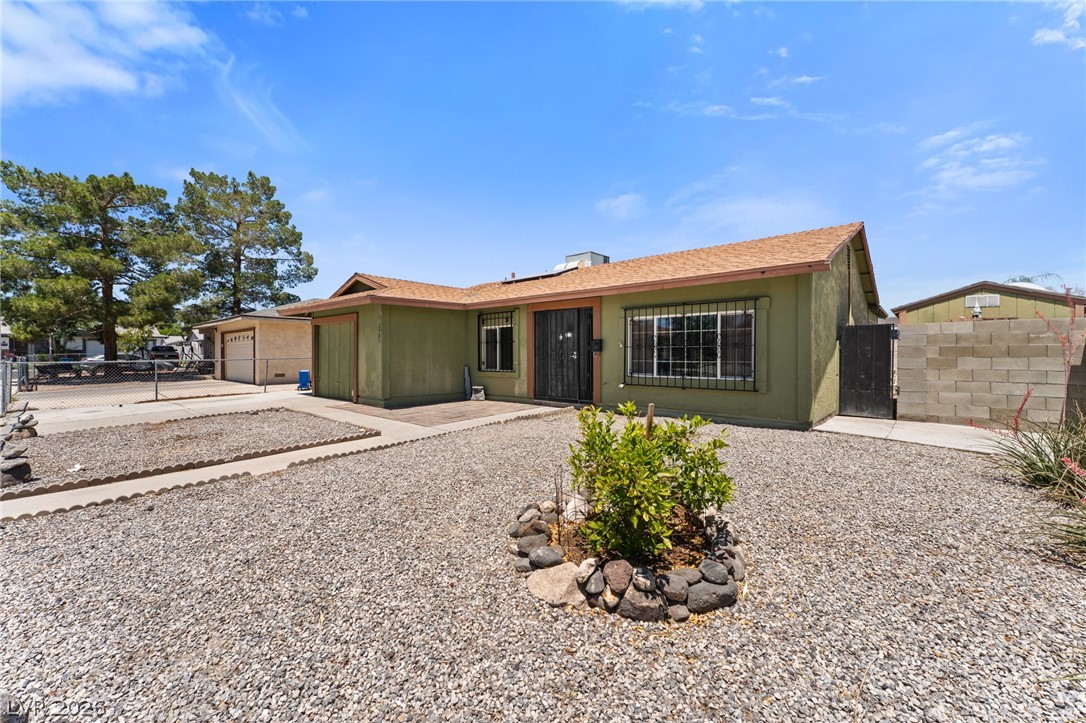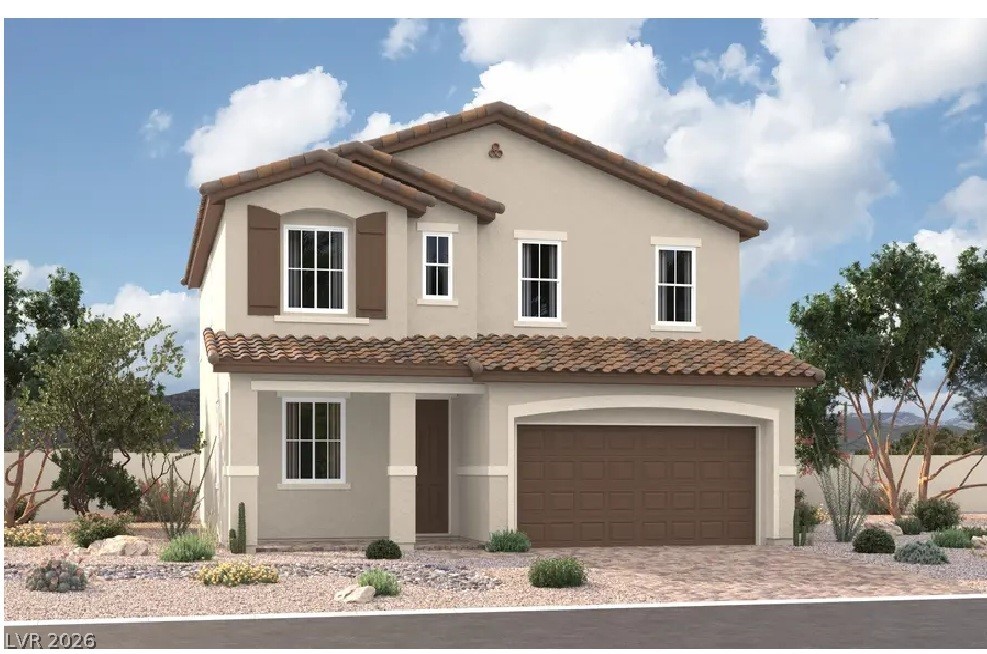

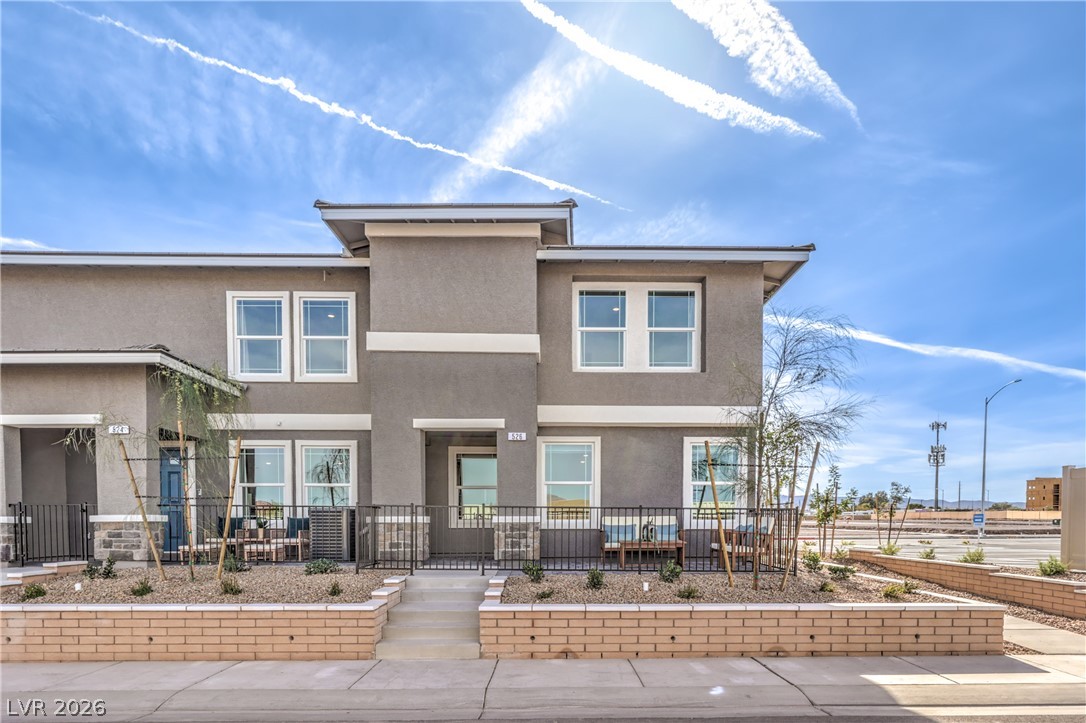
$349,990
3 bedrooms3 bathrooms1,410 square feet
917 Black Heron Street, Henderson 89011
$248 a sq ft, sold in 3 days at 100% of list
Symmetry Trails IIIDX MLS 2824387
Las Vegas is a balanced market. At the pace of the last six months, the 14,773 homes for sale now would take 5.9 months to sell.
GLVAR data pulled November 2, 2026. October is the last full month.
2,007 closed sales in October 2026 and 14,773 homes for sale, GLVAR, pulled November 2, 2026. Changes compare with October 2025.
Las Vegas is a balanced market. The 14,773 homes for sale now would take 5.9 months to sell at the pace of the last six months, about 2,525 sales a month. Supply is balanced between buyers and sellers.
Months of supply counts today's homes for sale against the average month of closed sales from May 2026 to October 2026.
Selling in this market? Price is what moves a home now. Start from the sales most like yours.
Get my home valueSearch homesUp. The median sale price in October was $430,000, up 1.2% from October 2025.
The median sale price was $430,000 in October, up 1.2% from $425,000 in October 2025.
| Month | Median sale price | A year earlier |
|---|---|---|
| November 2025 | $433,995 | – |
| December 2025 | $433,000 | $422,750 |
| January 2026 | $423,493 | $425,000 |
| February 2026 | $430,000 | $421,745 |
| March 2026 | $437,900 | $435,000 |
| April 2026 | $430,000 | $433,000 |
| May 2026 | $440,000 | $435,000 |
| June 2026 | $445,000 | $435,000 |
| July 2026 | $435,000 | $435,000 |
| August 2026 | $434,900 | $430,000 |
| September 2026 | $430,000 | $429,975 |
| October 2026 | $430,000 | $425,000 |
Median sale price by month, GLVAR closed sales, November 2025 to October 2026 beside the year before. Pulled November 2, 2026. A month with fewer than 10 sales is left out.
Homes sold for a median of $244 a square foot in October, down 2.8% from $251 a year earlier.
| Month | Median price per sq ft | A year earlier |
|---|---|---|
| November 2025 | $249 | – |
| December 2025 | $250 | $253 |
| January 2026 | $246 | $254 |
| February 2026 | $249 | $254 |
| March 2026 | $251 | $258 |
| April 2026 | $250 | $258 |
| May 2026 | $252 | $258 |
| June 2026 | $250 | $256 |
| July 2026 | $248 | $254 |
| August 2026 | $247 | $252 |
| September 2026 | $249 | $250 |
| October 2026 | $244 | $251 |
Median sale price per square foot of living area, GLVAR closed sales, November 2025 to October 2026 beside the year before. Pulled November 2, 2026. A month with fewer than 10 sales is left out.
Where does your home sit on this line? Your range comes from the sales most like it, not the whole valley.
Get my home valueHomes that sold in October took a median of 34 days to sell, about the same as a year earlier.
2,007 homes sold in October, 16.7% fewer than the 2,408 in October 2025.
| Month | Homes sold | A year earlier |
|---|---|---|
| November 2025 | 2,060 sales | – |
| December 2025 | 2,475 sales | 2,490 sales |
| January 2026 | 1,970 sales | 2,170 sales |
| February 2026 | 2,231 sales | 2,476 sales |
| March 2026 | 2,963 sales | 2,923 sales |
| April 2026 | 2,792 sales | 2,934 sales |
| May 2026 | 2,700 sales | 2,832 sales |
| June 2026 | 2,978 sales | 2,622 sales |
| July 2026 | 2,757 sales | 2,701 sales |
| August 2026 | 2,404 sales | 2,444 sales |
| September 2026 | 2,302 sales | 2,508 sales |
| October 2026 | 2,007 sales | 2,408 sales |
Closed sales by month, GLVAR closed sales, November 2025 to October 2026 beside the year before. Pulled November 2, 2026. A month with fewer than 10 sales is left out.
Homes that sold in October took a median of 34 days to sell, about the same as a year earlier.
| Month | Median days on market | A year earlier |
|---|---|---|
| November 2025 | 37 days | – |
| December 2025 | 38 days | 31 days |
| January 2026 | 42 days | 35 days |
| February 2026 | 39 days | 30 days |
| March 2026 | 27 days | 26 days |
| April 2026 | 27 days | 24 days |
| May 2026 | 27 days | 23 days |
| June 2026 | 27 days | 24 days |
| July 2026 | 27 days | 28 days |
| August 2026 | 31 days | 28 days |
| September 2026 | 29 days | 32 days |
| October 2026 | 34 days | 34 days |
Median days on market for homes that closed each month, GLVAR closed sales, November 2025 to October 2026 beside the year before. Pulled November 2, 2026. A month with fewer than 10 sales is left out.
The median home sold for 96% of its first asking price in October, against 96.7% in October 2025.
| Month | Sale to first asking price | A year earlier |
|---|---|---|
| November 2025 | 96.4% | – |
| December 2025 | 96.5% | 97.5% |
| January 2026 | 96.5% | 97.4% |
| February 2026 | 97.2% | 97.8% |
| March 2026 | 97.7% | 98.0% |
| April 2026 | 97.7% | 98.1% |
| May 2026 | 97.7% | 97.9% |
| June 2026 | 97.7% | 97.6% |
| July 2026 | 97.5% | 97.2% |
| August 2026 | 97.0% | 97.2% |
| September 2026 | 97.1% | 96.8% |
| October 2026 | 96.0% | 96.7% |
Median sale price as a share of the first asking price, GLVAR closed sales, November 2025 to October 2026 beside the year before. Pulled November 2, 2026. A month with fewer than 10 sales is left out.
Timing a sale? See how we price, launch, and negotiate in a market moving at this pace.
See how we sell homesProvidence leads: homes there sold in a median of 19 days at 99% of their first asking price over the last six months. The hottest are first, by how fast homes sold and how close to asking; the darker the row, the hotter.
Communities with at least 30 sales in six months and a page on this site. Change compares the median sale price with the same six months last year.
Each city links to its own seller page with its sales and a home value.
Comparing neighborhoods? Every community side by side, with prices, HOA dues, and pace.
Compare communitiesSupply is tightest from $400K to $500K, where the homes for sale would sell in 4.3 months. Buyers have the most room under $200K, at 13.2 months.
Months of supply in each row is that row's homes for sale against its average month of sales over the last six months. Under four favors sellers; over six favors buyers. GLVAR, pulled November 2, 2026.
Shopping in a tight price range? The good ones go first. Get them the morning they list.
Set up listing alerts See the latest price cutsStart with your home's value. We follow up with a monthly report on your home: its value range, the sales near you, and this Las Vegas market.
Private and free. Your range shows right away, and a local agent follows up with an exact number.
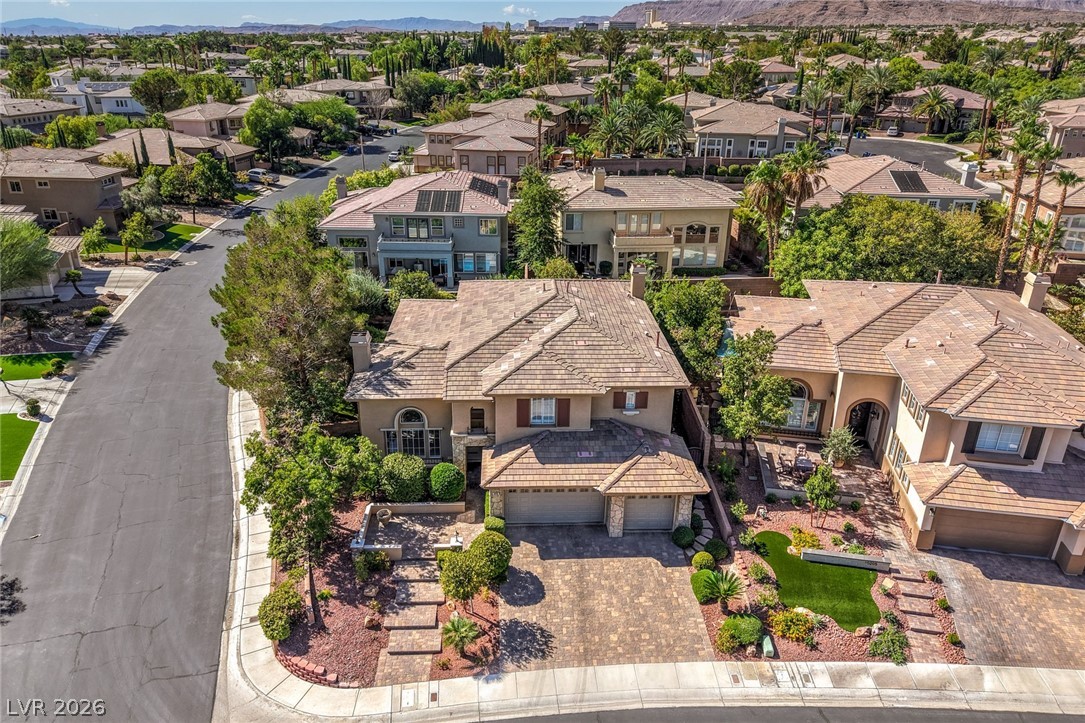
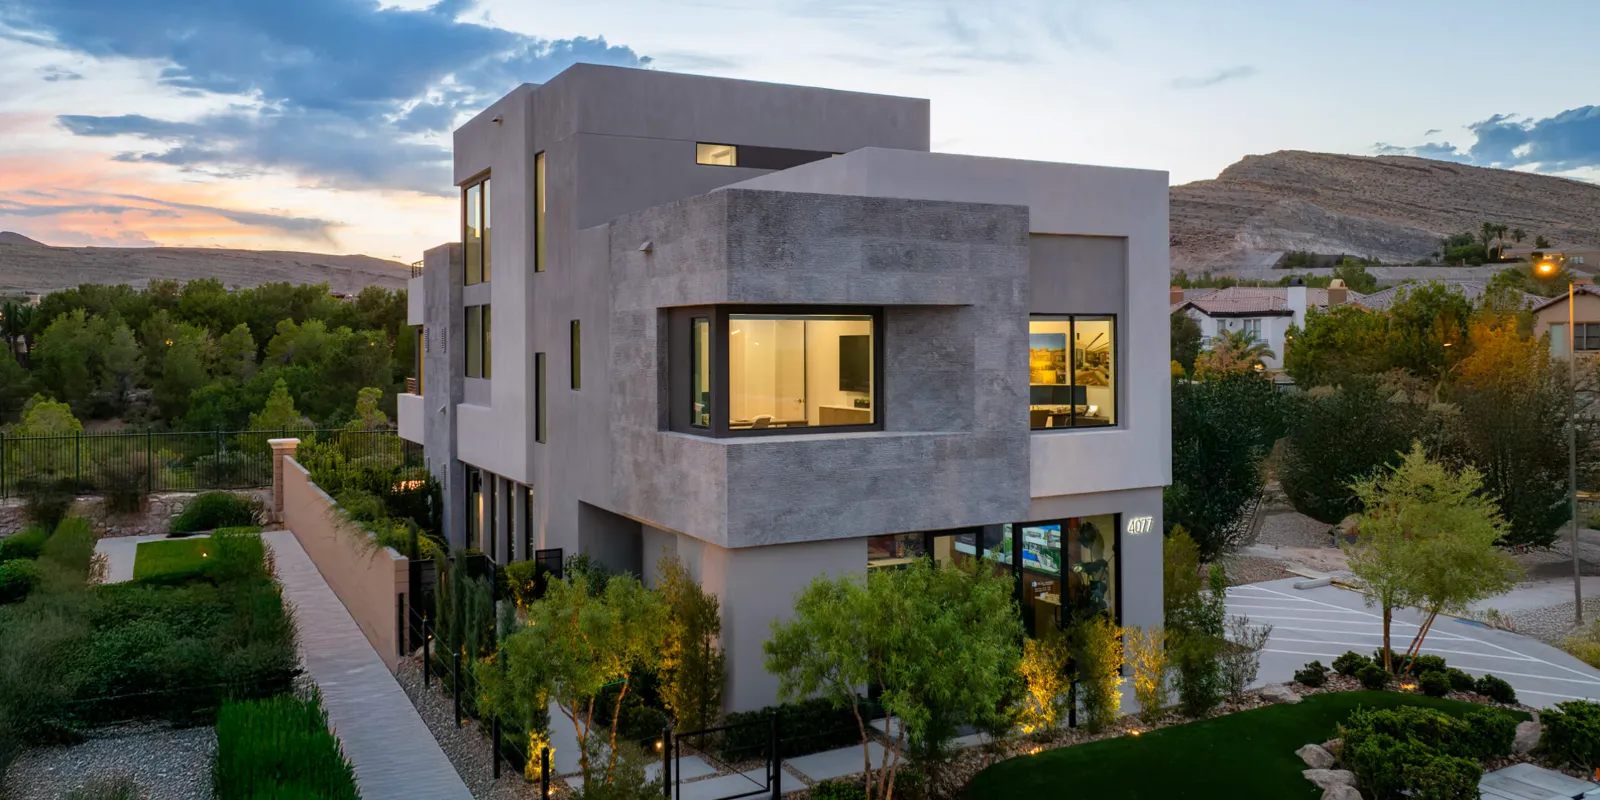
The three highest closed prices of October 2026, with their real listing photos. The top sale closed at $25,000,000.
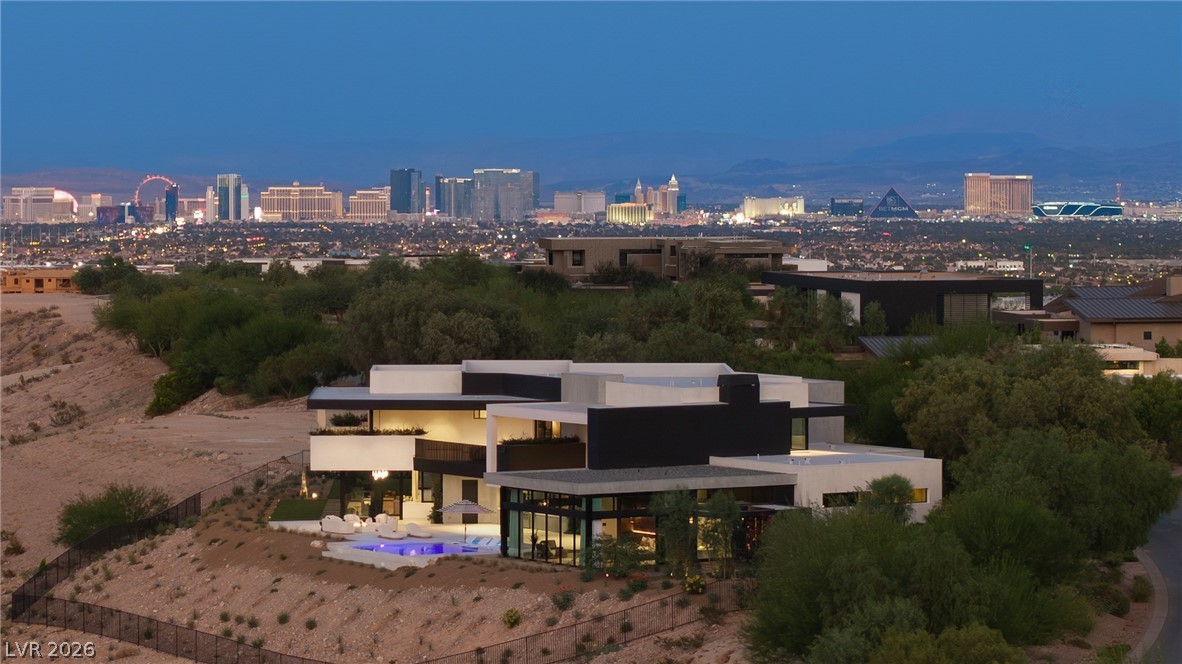 Sold Oct 6No. 1
$25,000,0006 bd · 9 ba · 11,126 sq ft11588 Stardust Drive, Summerlin Village 17 Phase 1
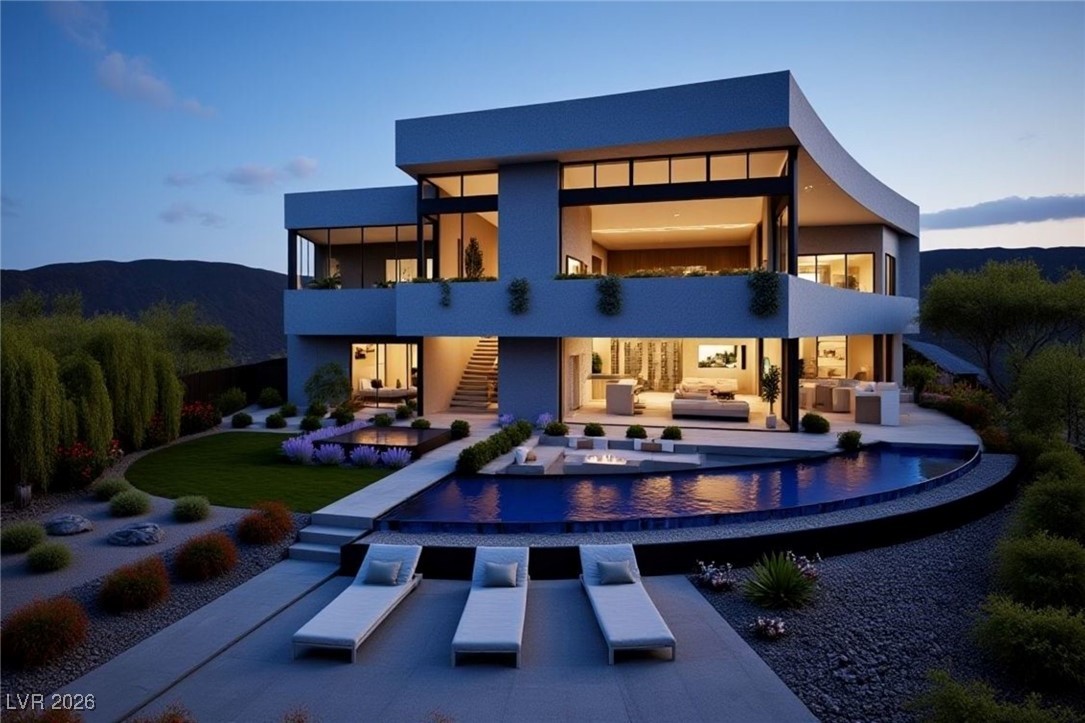 Sold Oct 13No. 2
$13,900,0006 bd · 8 ba · 9,350 sq ft483 Rock Peak Drive, McDonald Highlands Planning Area 18 Phase 3 Amd
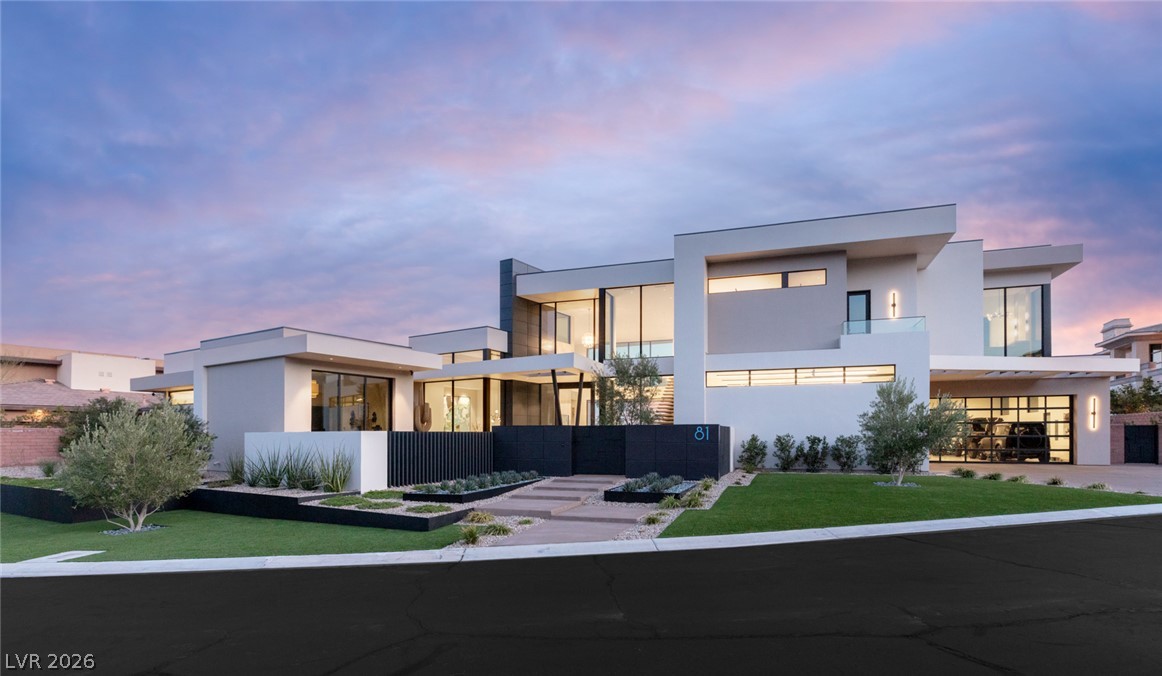 Sold Oct 7No. 3
$8,550,0004 bd · 5 ba · 6,285 sq ft81 Hawk Ridge Drive, THE RIDGES - REDHAWK
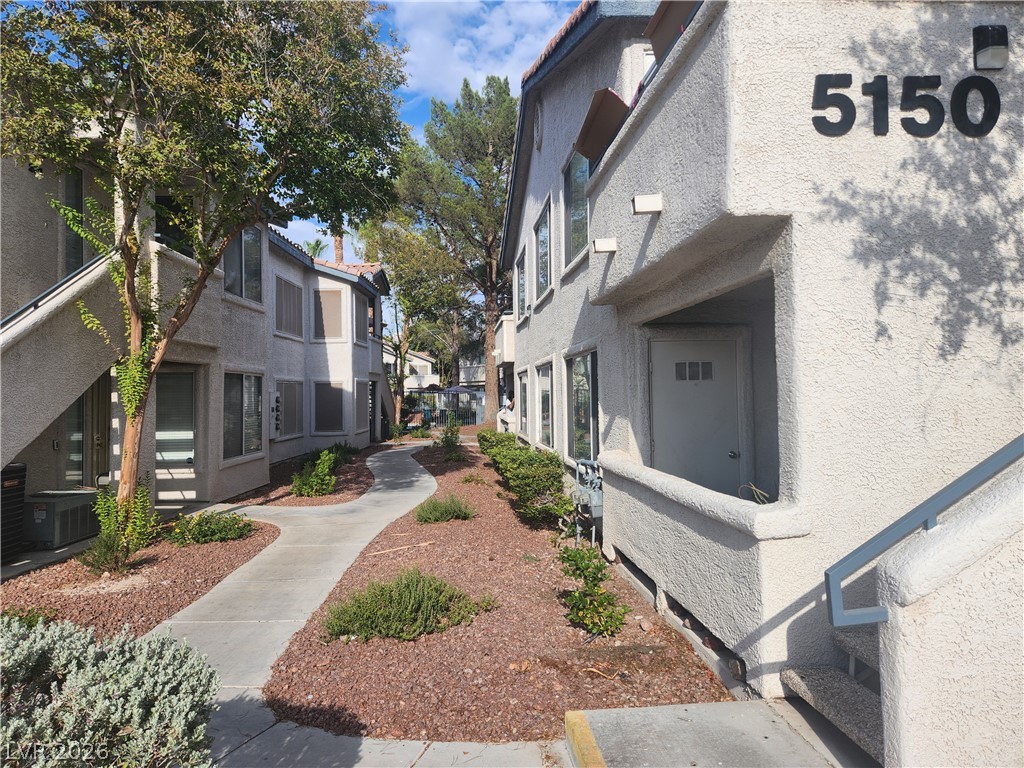
The 8 newest closed sales with photos, newest first.
$248 a sq ft, sold in 3 days at 100% of list
$328 a sq ft, sold in 12 days at 91.8% of list
$257 a sq ft, sold in 8 days at 100.2% of list
$142 a sq ft, sold in 80 days at 90.3% of list
$287 a sq ft, sold in 90 days at 95.9% of list
$260 a sq ft, sold in 94 days at 89.1% of list
$232 a sq ft, sold in 119 days at 88% of list
$231 a sq ft, sold in 176 days at 87.1% of list
Wondering what yours would bring? Your range starts from sales like these near you.
Get my home valueThe same numbers read two ways. Here is what October 2026 says if you are selling and if you are buying.
+1.2%prices from a year ago
5.9 monthsof supply
One text per day at most, only when something new matches. No spam, and you can stop any time.
116 ZIP codes have homes for sale or recent sales. Each links to its own page with the homes for sale there, its trend, and the communities inside it.
| ZIP code | Area | Homes for sale | Median list price | Median sale price | Days to sell |
|---|---|---|---|---|---|
| 89048 | Pahrump | 986 | $55,000 | $260,000 | 39 |
| 89011 | Cadence | 678 | $540,000 | $495,000 | 36 |
| 89060 | Green Valley | 579 | $40,000 | $170,000 | 43 |
| 89052 | Anthem | 388 | $667,500 | $640,000 | 32 |
| 89109 | Las Vegas Country Club | 328 | $379,500 | $335,000 | 62 |
| 89129 | Lone Mountain | 319 | $470,000 | $410,000 | 25 |
| 89012 | Macdonald Highlands | 318 | $799,444 | $587,500 | 32 |
| 89135 | Summerlin | 316 | $894,944 | $865,000 | 35 |
| 89138 | Summerlin | 315 | $819,900 | $770,000 | 38 |
| 89117 | The Lakes | 315 | $525,000 | $518,000 | 24 |
| 89103 | Las Vegas | 313 | $255,000 | $329,000 | 31 |
| 89139 | Las Vegas | 311 | $443,888 | $485,000 | 33 |
| 89166 | Skye Canyon | 307 | $535,000 | $507,000 | 34 |
| 89113 | Spanish Trail | 293 | $575,000 | $504,000 | 35 |
| 89015 | Cadence | 288 | $447,495 | $410,000 | 30 |
| 89149 | Centennial Hills | 288 | $604,950 | $489,000 | 25 |
| 89121 | Las Vegas | 269 | $374,900 | $372,875 | 30 |
| 89141 | Southern Highlands | 263 | $609,900 | $540,075 | 29 |
| 89148 | Rhodes Ranch | 258 | $514,950 | $464,975 | 30 |
| 89084 | Aliante | 255 | $469,900 | $454,000 | 22 |
| 89044 | Inspirada | 253 | $549,999 | $532,375 | 35 |
| 89123 | Green Valley | 252 | $475,000 | $440,000 | 28 |
| 89134 | Summerlin | 250 | $477,000 | $485,000 | 32 |
| 89122 | Las Vegas | 248 | $329,900 | $329,440 | 27 |
| 89108 | Lone Mountain | 243 | $329,000 | $365,000 | 19 |
| 89031 | Lone Mountain | 238 | $420,000 | $420,000 | 20 |
| 89074 | Green Valley | 237 | $510,000 | $450,000 | 29 |
| 89061 | Pahrump | 234 | $379,700 | $369,900 | 61 |
| 89178 | Mountains Edge | 233 | $514,000 | $470,000 | 28 |
| 89131 | Centennial Hills | 230 | $635,000 | $565,000 | 26 |
| 89147 | Las Vegas | 205 | $424,900 | $403,500 | 23 |
| 89128 | Desert Shores | 205 | $299,000 | $397,450 | 35 |
| 89183 | Las Vegas | 193 | $399,999 | $399,000 | 30 |
| 89101 | Downtown Las Vegas | 179 | $379,900 | $330,000 | 34 |
| 89002 | Henderson | 178 | $509,500 | $475,000 | 27 |
| 89029 | Laughlin | 174 | $189,945 | $247,495 | 45 |
| 89110 | Las Vegas | 172 | $369,475 | $375,000 | 23 |
| 89119 | Las Vegas | 170 | $215,000 | $359,900 | 30 |
| 89014 | Green Valley | 168 | $425,000 | $430,000 | 27 |
| 89030 | North Las Vegas | 163 | $250,000 | $325,000 | 30 |
| 89130 | Los Prados | 162 | $448,444 | $445,000 | 24 |
| 89032 | North Las Vegas | 161 | $419,900 | $410,000 | 20 |
| 89118 | Las Vegas | 154 | $364,950 | $322,000 | 38 |
| 89081 | Lone Mountain | 146 | $424,995 | $415,000 | 22 |
| 89120 | Las Vegas | 143 | $519,000 | $420,000 | 20 |
| 89005 | Tuscany | 142 | $464,450 | $447,500 | 35 |
| 89156 | Las Vegas | 141 | $365,000 | $330,000 | 21 |
| 89144 | Summerlin | 139 | $619,998 | $518,000 | 25 |
| 89169 | Paradise Palms | 138 | $229,450 | $290,000 | 46 |
| 89102 | McNeil Estates | 135 | $400,000 | $365,000 | 19 |
| 89145 | Queensridge | 131 | $434,998 | $397,000 | 23 |
| 89115 | Las Vegas | 129 | $355,000 | $344,000 | 28 |
| 89107 | Las Vegas | 125 | $359,900 | $359,000 | 21 |
| 89142 | Las Vegas | 104 | $329,950 | $376,200 | 16 |
| 89104 | Las Vegas | 103 | $385,000 | $390,000 | 20 |
| 89106 | Las Vegas | 93 | $344,000 | $350,000 | 19 |
| 89143 | Sunstone | 92 | $528,000 | $595,950 | 33 |
| 89146 | Las Vegas | 91 | $394,999 | $435,000 | 33 |
| 89124 | Mount Charleston | 72 | $665,000 | $365,000 | 52 |
| 89086 | Del Webb at North Ranch | 69 | $389,900 | $420,000 | 34 |
| 89027 | Mesquite | 69 | $405,000 | $400,000 | 40 |
| 89019 | Sandy Valley | 65 | $149,999 | $140,000 | 50 |
| 89301 | Ely | 60 | $179,450 | $189,000 | 36 |
| 89040 | Overton | 57 | $212,500 | $350,000 | 72 |
| 89179 | Mountains Edge | 53 | $498,000 | $440,500 | 23 |
| 89158 | Las Vegas | 48 | $1,100,000 | $700,000 | 48 |
| 89021 | Logandale | 41 | $529,000 | $487,500 | 35 |
| 89020 | Amargosa Valley | 37 | $67,000 | $90,000 | 50 |
| 89046 | Searchlight | 28 | $245,500 | $110,000 | 121 |
| 89008 | Caliente | 24 | $190,000 | $142,500 | 45 |
| 89161 | Las Vegas | 22 | $1,075,000 | $525,000 | 157 |
| 89043 | Pioche | 21 | $282,500 | $218,500 | 72 |
| 89025 | Moapa | 21 | $95,000 | $352,000 | 57 |
| 89018 | Indian Springs | 19 | $370,000 | $389,500 | 53 |
| 89013 | Goldfield | 16 | $117,350 | $22,625 | 164 |
| 89001 | Alamo | 13 | $285,000 | $205,000 | 42 |
| 89085 | Aliante | 9 | $524,900 | $497,000 | 17 |
| 89049 | Tonopah | 9 | $99,000 | $249,999 | 373 |
| 89003 | Beatty | 7 | $150,000 | $100,000 | 10 |
| 89039 | Palm Gardens | 7 | $44,900 | $158,500 | 281 |
| 89034 | Anthem | 5 | $459,900 | $432,500 | 28 |
| 84719 | Brian Head | 5 | $167,900 | – | – |
| 89318 | McGill | 4 | $83,875 | $129,500 | 56 |
| 89010 | Dyer | 4 | $51,700 | $76,500 | 122 |
| 89317 | Other | 4 | $152,500 | $310,000 | 27 |
| 89042 | Panaca | 4 | $214,950 | $167,933 | 112 |
| 89041 | Pahrump | 4 | $281,580 | – | – |
| 89311 | Other | 3 | $115,000 | $56,250 | 114 |
| 84762 | Duck Creek Village | 3 | $770,000 | – | – |
| 89801 | Elko | 3 | $29,000 | – | – |
| 84721 | Cedar City | 2 | $309,450 | – | – |
| 84735 | Hatch | 2 | $332,400 | – | – |
| 89007 | Moapa | 2 | $1,604,500 | – | – |
| 89445 | Other | 2 | $1,273,500 | – | – |
| 89045 | Pahrump | 1 | $11,000 | $10,000 | 9 |
| 89054 | Las Vegas | 1 | $2,750,000 | $1,350,000 | 52 |
| 89319 | Ruth | 1 | $160,000 | $93,000 | 65 |
| 00000 | Elko | 1 | $80,000 | – | – |
| 05383 | Other | 1 | $781,000 | – | – |
| 17090 | Other | 1 | $735,000 | – | – |
| 66000 | Other | 1 | $660,000 | – | – |
| 84021 | Other | 1 | $15,000 | – | – |
| 84720 | Cedar City | 1 | $49,900 | – | – |
| 84751 | Other | 1 | $23,500 | – | – |
| 84756 | Beryl | 1 | $7,000 | – | – |
| 84761 | Parowan | 1 | $849,900 | – | – |
| 89000 | North Las Vegas | 1 | $31,000 | – | – |
| 89165 | North Las Vegas | 1 | $2,400,000 | – | – |
| 89409 | Other | 1 | $27,000 | – | – |
| 89410 | Other | 1 | $2,999,000 | – | – |
| 89820 | Other | 1 | $75,000 | – | – |
| 92389 | Other | 1 | $50,000,000 | – | – |
| 89022 | Manhattan | – | – | $179,000 | 387 |
| 89815 | Elko | – | – | $370,000 | 14 |
| 89835 | Wells | – | – | $96,000 | 78 |
| 89918 | Las Vegas | – | – | $368,000 | 39 |
Live from GLVAR as of November 2, 2026. Sale price and days to sell are medians for homes that closed in the last six months. Area is the community or city most of a ZIP code's listings sit in.
Las Vegas is a balanced market, with 5.9 months of supply: the time the 14,773 homes for sale now would take to sell at the pace of the last six months. Under four months favors sellers, four to six is balanced, and over six favors buyers.
The median Las Vegas home sold for $430,000 in October, up 1.2% from $425,000 in October 2025.
Up: the median sale price in October 2026 was $430,000, up 1.2% from $425,000 a year earlier. Price per square foot was $244.
Homes that sold in October took a median of 34 days to sell, about the same as a year earlier.
Most do not: the median home sold for 96% of its first asking price in October.
Over the last six months the hottest communities were Providence (19 days at 99% of asking), Mountains Edge (28 days at 97.9% of asking) and Centennial Hills (27 days at 97.7% of asking), counting how fast homes sold and how close to their first asking price.
Every number is read from GLVAR listings, sold and for sale, and was pulled November 2, 2026. October 2026 is the last full month. Sale to list compares each sale with its first asking price.
Tell us what you are after and we will reply the same day with real answers, not a drip campaign.